How to download a report of sales per item
Last updated February 11, 2025
If you’ve been in business for a while, you probably have a sense of what your best sellers are, but sometimes you need the cold hard data on what’s selling (and what’s not!). We can help!
Currently, you won’t see a sales breakdown by item on your Insights page, but you can download a summary of your order history from the Orders tab, then do some quick addition of the columns in your downloaded spreadsheet. Here’s how:
- Go to your Orders tab
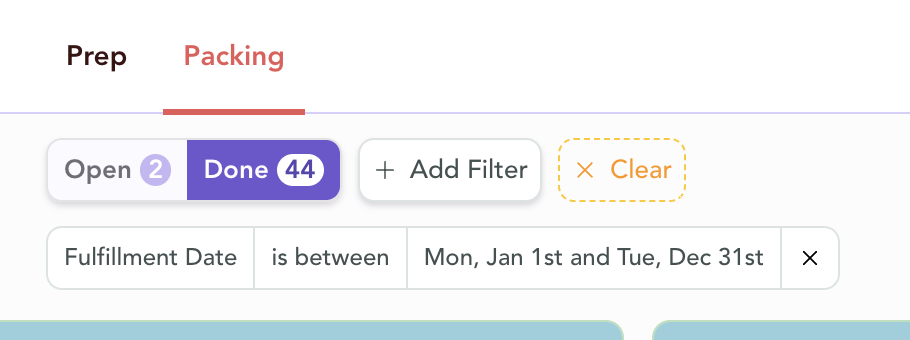
- Click the Filter button then select the date range for which you want order data
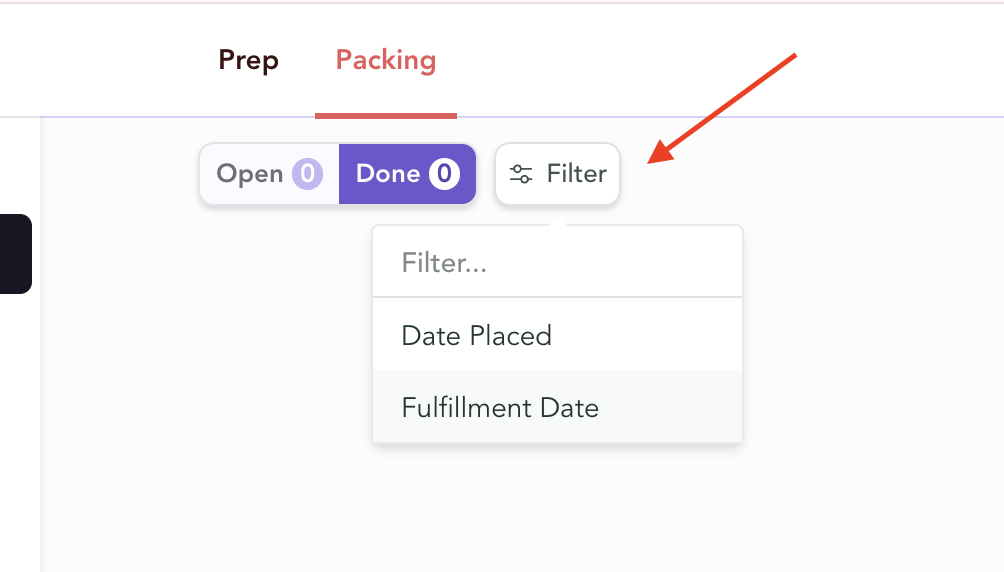
For example, if you want to see a summary of all your orders in 2024, select the fulfillment date between January 1 and December 31. Go to the Done tab, and you’ll see all the completed order tickets from time period.
- Click the three dots in the top right, then click Export Orders
- Toggle on Export items as columns instead of rows
- Click Export
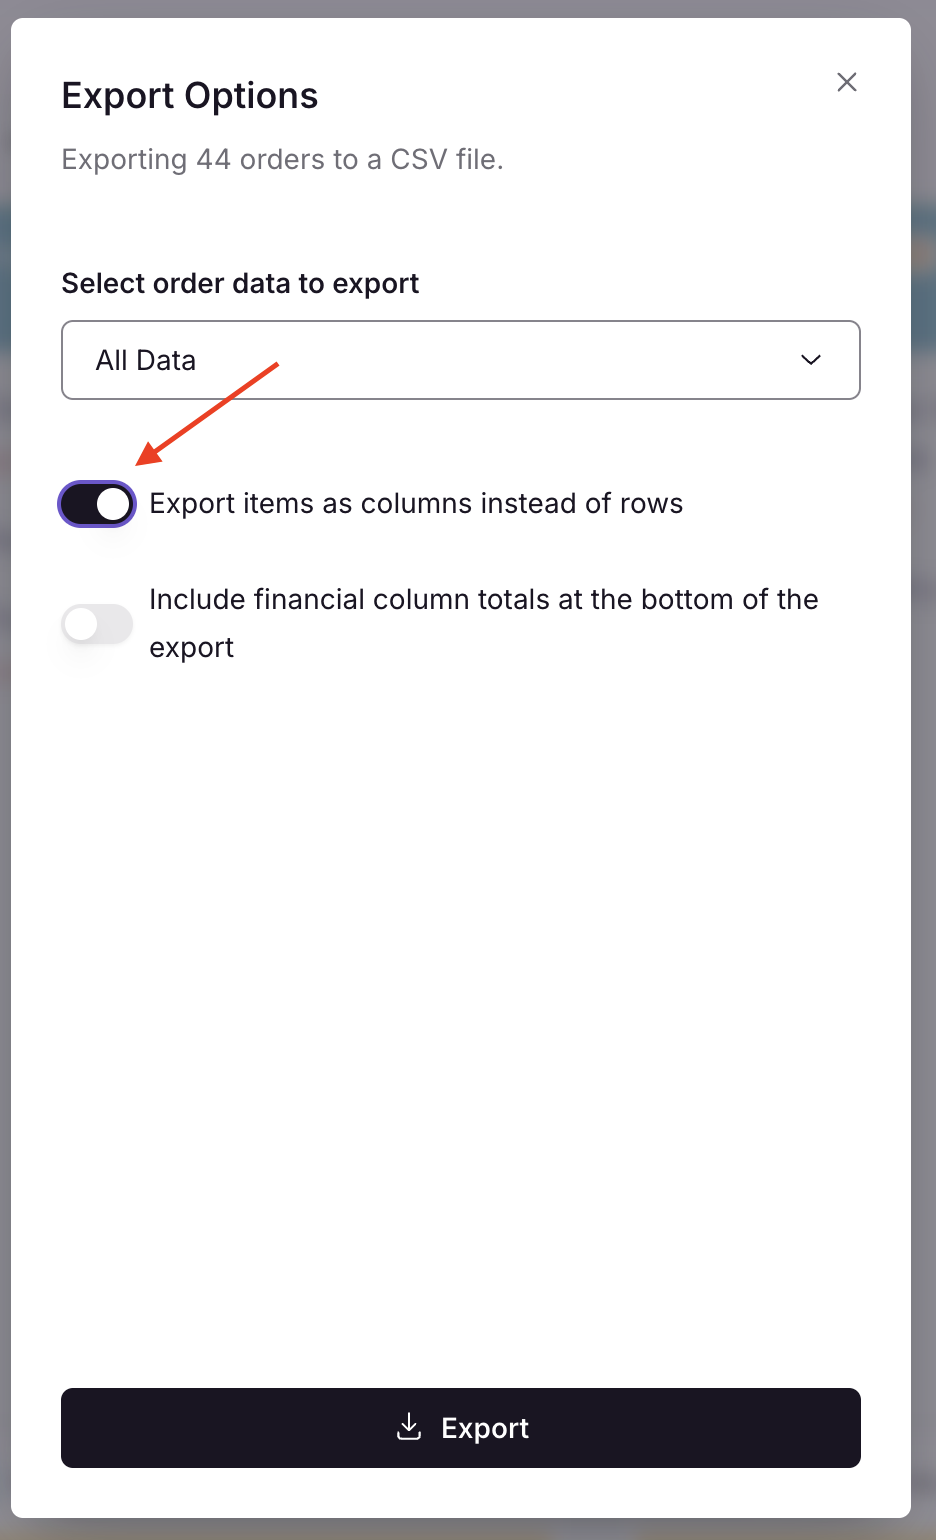
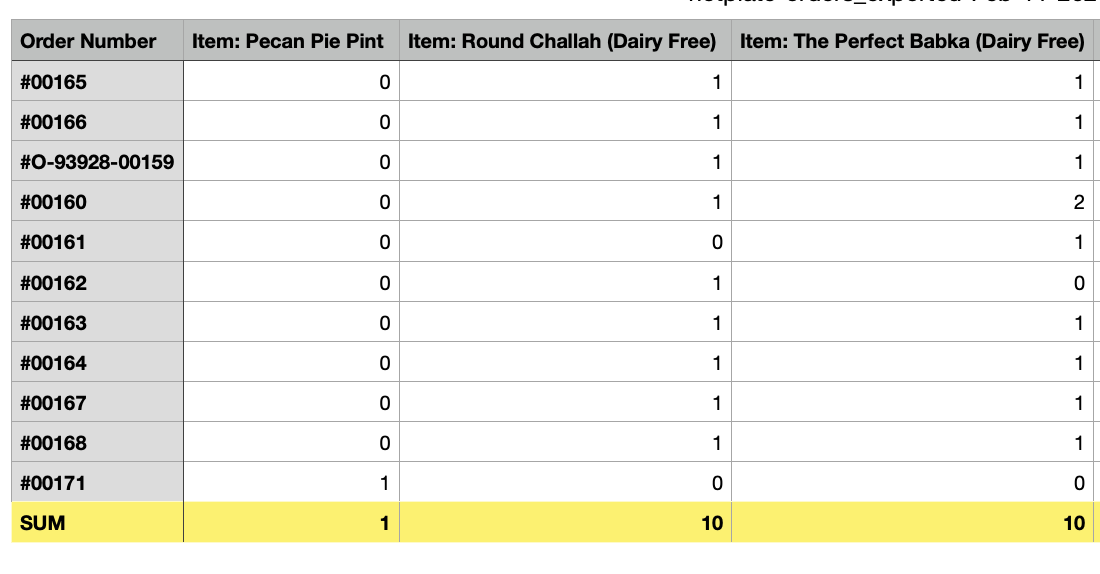
This will give you a spreadsheet with each item as a column and the rows as orders.
- To get a total sold for each item: open up the spreadsheet and add up each item column. You can do this very quickly by adding a row with the function SUM. Here’s a quick explainer on how to do this on Google Sheets (this is usually the same in Excel or Numbers).